Week 17 - 2025 Season
Matchup Matrix
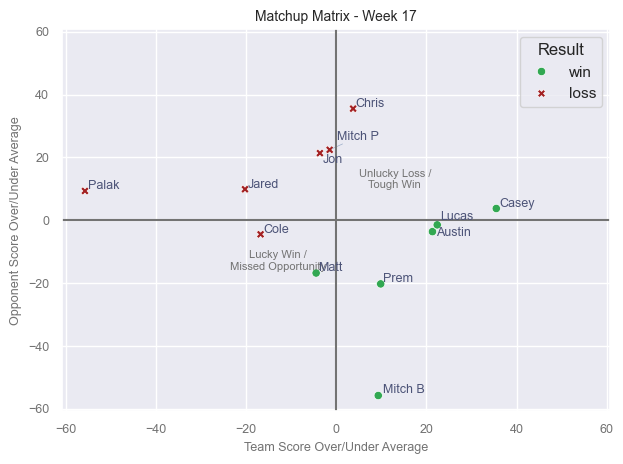
This is the result of each matchup over/under the league average for the week. - Right of the vertical line = scored above average - Above the horizontal line = opponent scored above average Top right = unlucky losses or tough wins. Bottom left = lucky wins or missed opportunities.
All-Play Win/Loss
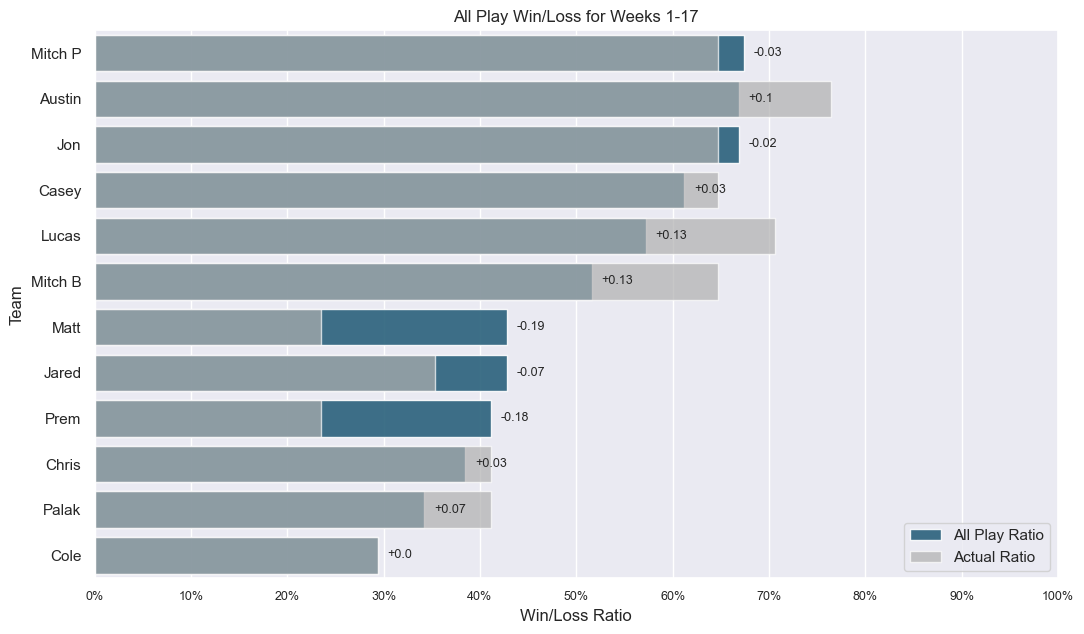
This shows each team's record if they played every team each week. It helps reduce schedule luck and shows how each team is actually performing.
Team Scores
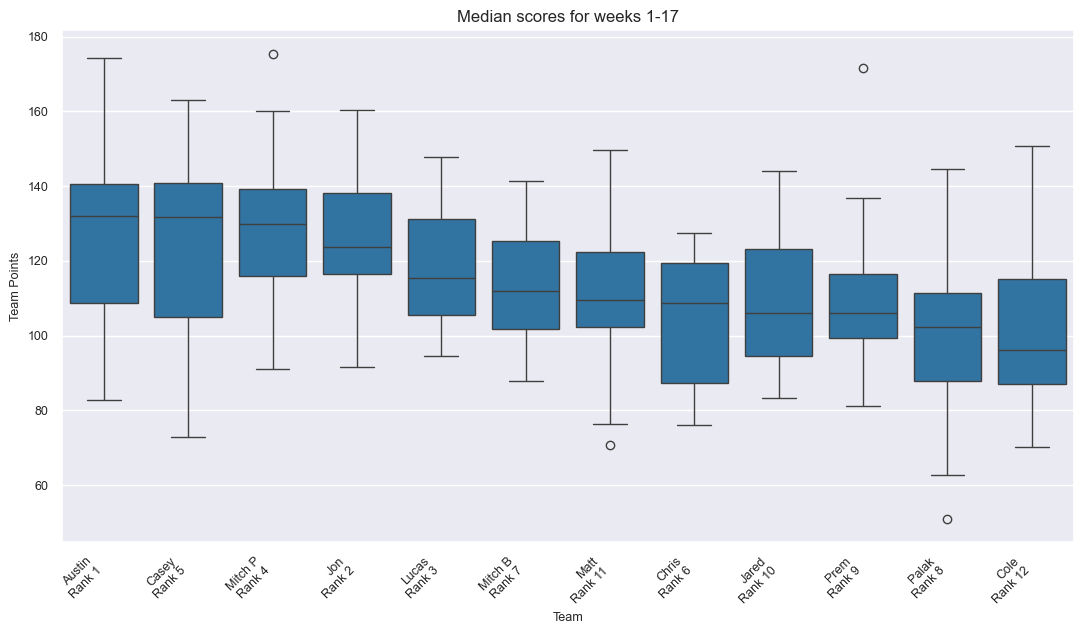
These are the box plots for each team using total scores YTD.
Power Rank by Week
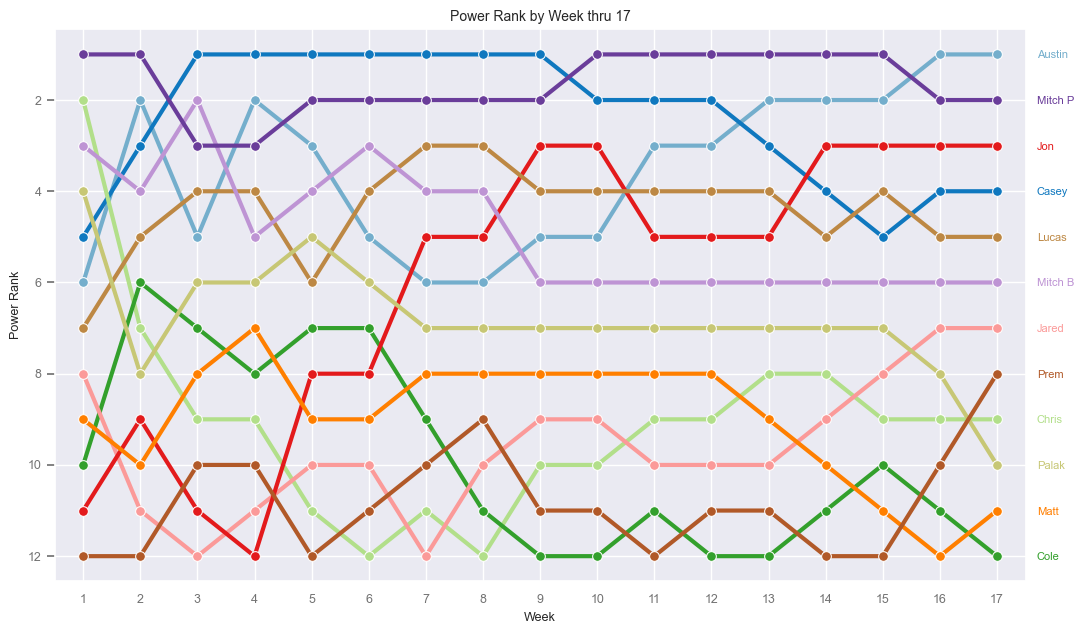
This shows weekly power ranking movement based on expected team strength.
Current Rank vs Power Rank
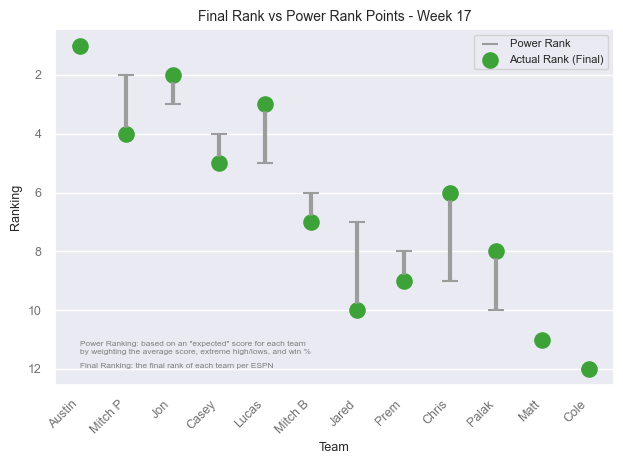
This compares actual standings against power ranking.
Draft vs Final Rank Movement
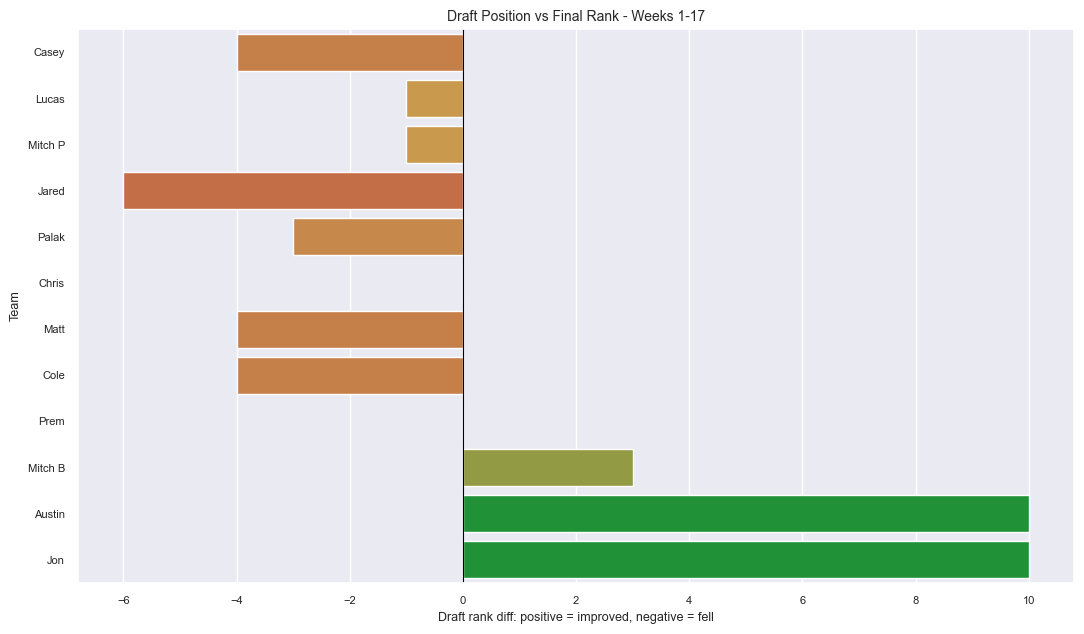
Shows how far each team has moved up or down from their preseason draft position, season to date.
Actual vs Optimal Lineup
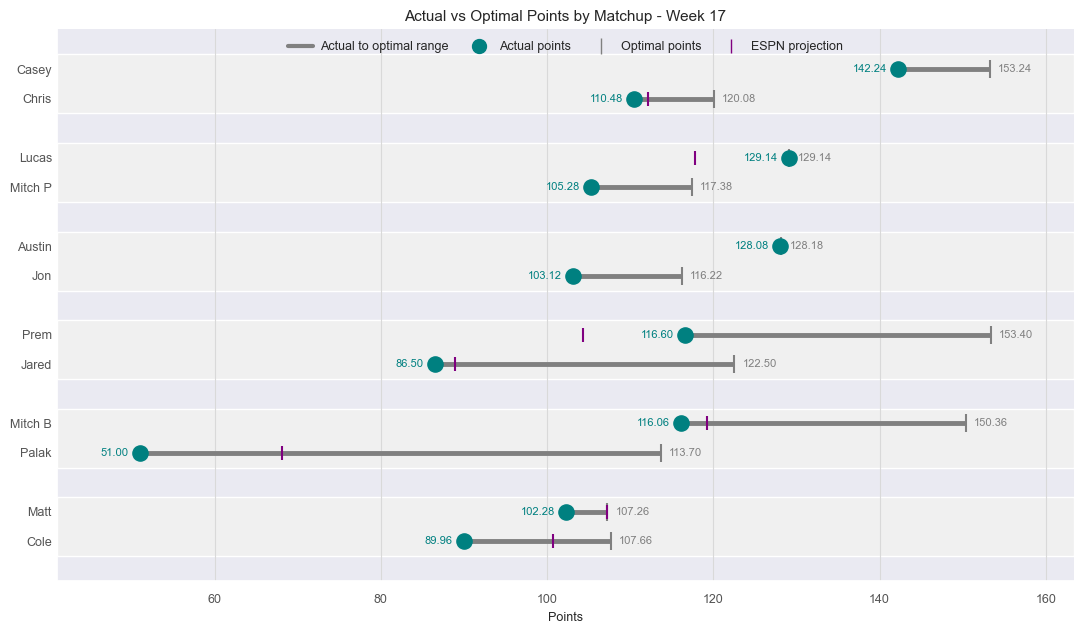
This shows actual and optimal scores for the week.
Opponent Difficulty Heatmap
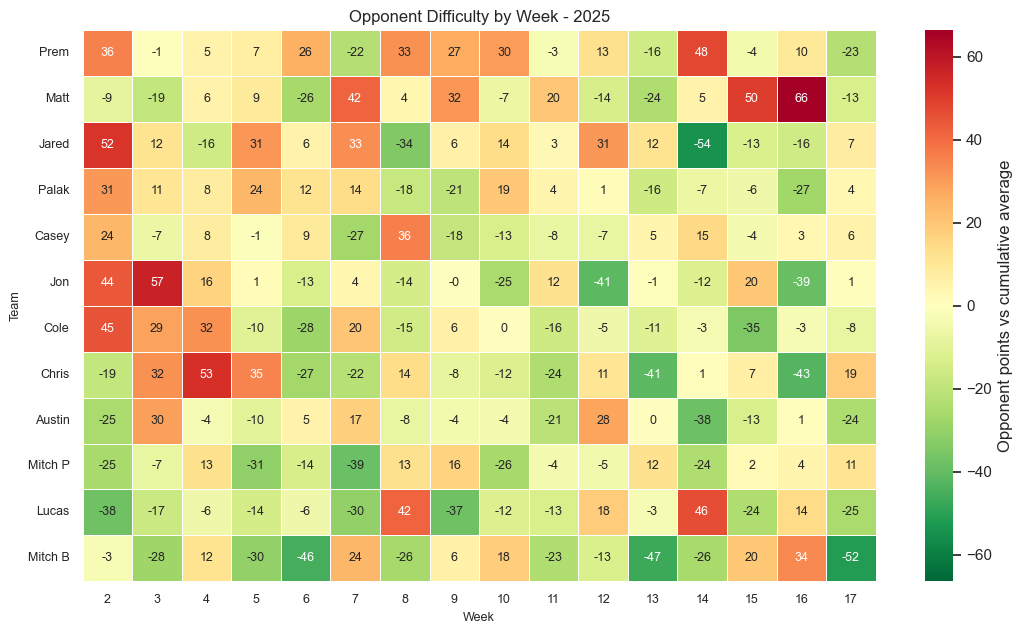
This shows each team's opponent score above or below their cumulative average. Red = opponent scored above their average, green = opponent scored below their average.
Opponent Difficulty Summary
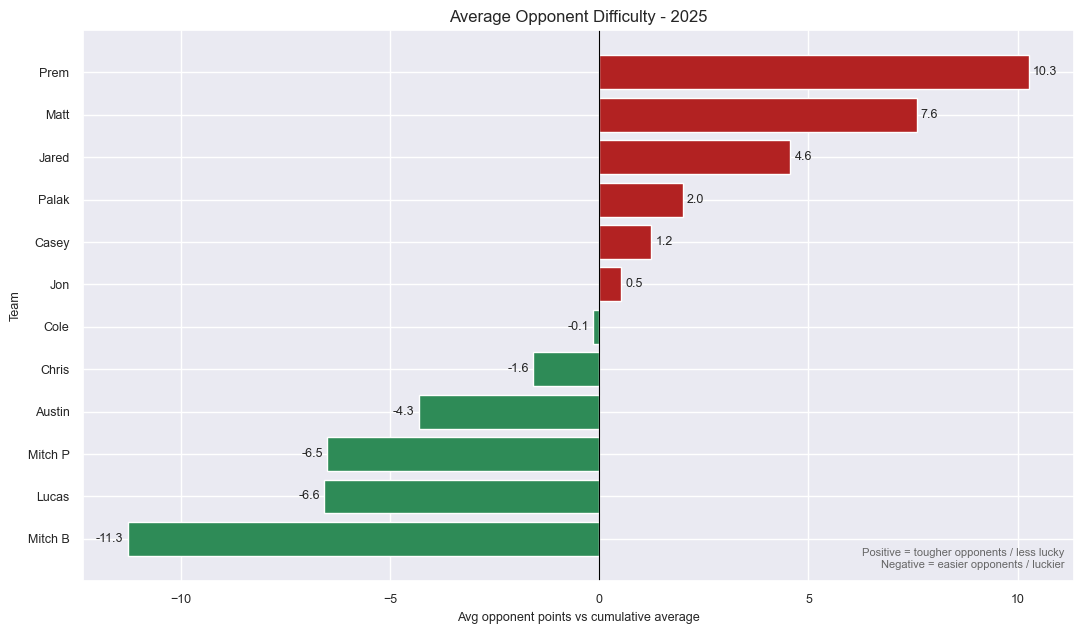
This summarizes opponent scoring difficulty across all weeks.